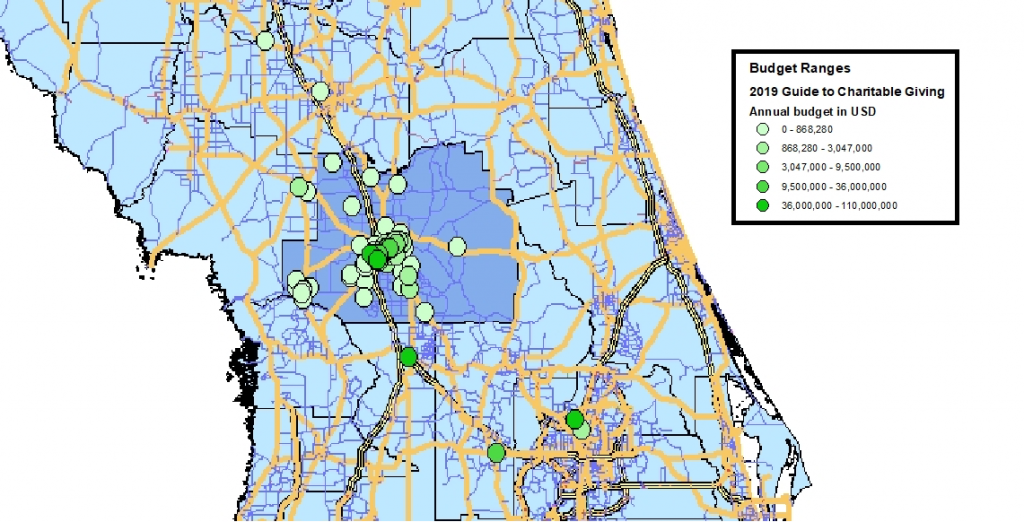
(We took our data from the recent Guide to Charitable Giving to incorporate nonprofit location to budget size in this map).
We have GIS! So what does that mean? It is an acronym that stands for Geographic Information System, and thanks to an in-kind donation to the Community Foundation from the inventor of GIS, the Environmental Systems Research Institute (ESRI), we have a licensed copy of their very powerful mapping and analysis software.
So, what does it do?
GIS does a lot of things, especially for our nonprofits. It shows you where you have been and can help you plan for where you are going. It can show you what is out in your locality, like resources for your organization, and how you might be able to use them. GIS can show you where your funds are going, where critical needs are, and how you have affected them through your mission. This system can show you where you need to focus future efforts and resources to make the most of your work. Want to easily demonstrate to your funders the effectiveness of your programs? Show them on a map included in your reporting. Represent the needs you plan to address in the same way, when applying for a grant.
How does GIS work?
A geographic Information system works by taking data and plotting it on a map, displaying known aspects of things already present in the world, and showing you how the data relates to what’s out there. Here is a brief example: You, as a nonprofit have a client base. They may come to you or you may serve them in their homes. Connecting with your clients means some kind of transportation is needed, and the type of service you offer. The vehicle you use to deliver services could take different forms. Plotting client locations on a map, and color coding or symbolizing the type of need they have and the frequency of visits could help you create a schedule to efficiently deploy your services.
What makes GIS so powerful?
Data. All of those tables and spreadsheets you have been creating can now be put into GIS, and you can see graphically how everything you do relates to everything else that is happening in your community. No more scratching your head as you pore over lists. Not only that, but data is freely shared by governments and businesses engaged in the use of GIS. So if you want to see what vacant land is available in the county, how it is zoned and how close it is to your clients, to prepare to relocate your facilities, you overlay your client locations on the county real property parcel database. Then overlay the FDOT road maps to show transit routes. Or, show traffic counts, so you can see just how many people might access your services or learn of your mission merely by driving by your new facility.
The possibilities are practically endless and growing, as more people use these systems and share their data openly. The Community Foundation is just getting started with GIS but we plan to offer you these possibilities soon. Give us a call (352) 622-5020, extension 109 or email us to learn more today. .

